
Kamana Sewa Bikas Bank: A Nine - Year Financial Performance Review (Q4 2074/75 to Q4 2082/83)
2026-07-22
Background of Kamana Sewa Bikas Bank (KSBBL)
Kamana Sewa Bikas Bank (KSBBL) was formed after the merger of the former Kamana Bikas Bank Ltd. and Sewa Bikas Bank Ltd. Both banks passed the merger agenda through their Special General Meetings (SGMs) held on Jestha 25, 2074. At that time, Sewa Bikas Bank's paid-up capital stood at Rs. 94.18 crore, while Kamana Bikas Bank's paid-up capital was Rs. 80.43 crore. Following the merger at a share swap ratio of 1:1, the newly established Kamana Sewa Bikas Bank had a paid-up capital of Rs. 1.74 arba and commenced joint operations on Srawan 20, 2074. The bank subsequently achieved the regulatory paid-up capital requirement for a national-level development bank by issuing right shares and distributing stock dividends.
Afterward, the bank emerged as a competitive national-level development bank. Currently, the bank is serving the nation through 123 branches by employing around 1,000 staff (as of the Annual Report 2081/82, the number of staff stood at 988) nationwide. As of Q4 2082/83, the bank's total assets stood at Rs. 75.63 billion, while total equity stood at Rs. 6.95 billion.
How did two small banks, Kamana Bikas Bank and Sewa Bikas Bank, established in two different cities Pokhara and Butwal, respectively and whose existence was once considered doubtful, become a national-level player in their own class? Let's look at the ups and downs in their financial performance during this nine-year journey (Q4 2074/75 to Q4 2082/83).
Balance Sheet Analysis
Assets
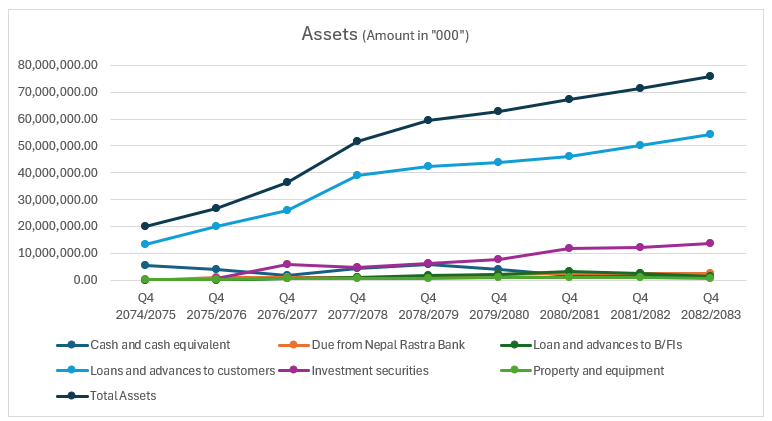
The overall asset size of KSBBL has increased by 3.80 times, from Rs. 19.85 billion to Rs. 75.63 billion. The proportion of Loans and Advances to Customers increased from 67.71% in the base year to 71.67% in Q4 2082/83. Below are the major asset indicators over the review period.
1. Cash and Cash Equivalents
Cash and cash equivalents declined from Rs. 5.39 billion to Rs. 1.49 billion. Holding cash and cash equivalents above the regulatory requirement is generally not considered efficient for banks. In this regard, KSBBL has done a good job by optimizing its liquidity position.
2. Loans and Advances to Customers
The bank has successfully expanded its core lending business. Loans and advances increased by 4.03 times, from Rs. 13.44 billion as of Q4 2074/75 to Rs. 54.21 billion by Q4 2082/83. Over the nine-year period, the bank achieved remarkable growth in business expansion.
3. Property and Equipment
Property and Equipment initially stood at Rs. 28.54 crore and showed an increasing trend, reaching Rs. 1.13 billion at its peak. As of Q4 2082/83, it stood at Rs. 82.63 crore. This category may also include certain non-banking properties.
4. Total Assets
Total assets increased rapidly during the initial years. Although the growth rate slowed in recent years, assets continued to grow steadily. Overall, KSBBL's asset base expanded by 3.80 times, increasing from Rs. 19.85 billion in Q4 2074/75 to Rs. 75.63 billion in Q4 2082/83.
Liabilities
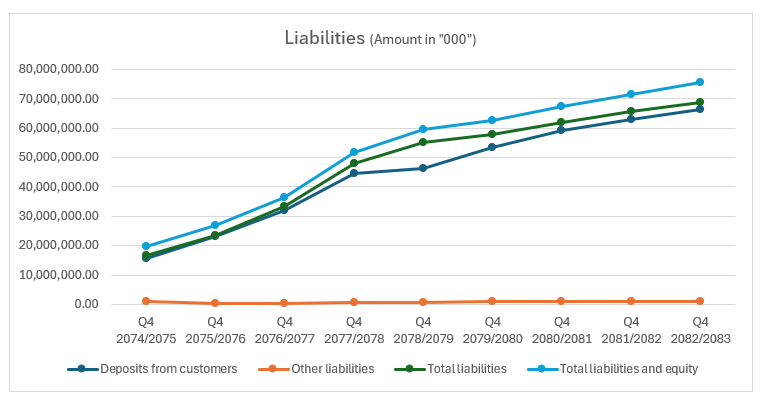
Total liabilities (excluding equity) stood at Rs. 16.62 billion in Q4 2074/75. They increased by 4.13 times, reaching Rs. 68.68 billion by Q4 2082/83. Deposits from customers, the bank's core liability, grew at an average annual rate of 20.74%, increasing from Rs. 15.75 billion to Rs. 66.17 billion. Meanwhile, total liabilities and equity combined increased from Rs. 19.85 billion to Rs. 75.63 billion. The major liability trends are discussed below.
1. Deposits from Customers
Deposits from customers increased at an average annual rate of 20.74%. Within total liabilities (excluding equity), deposits accounted for 94.72% in Q4 2074/75, increasing to 96.53% by Q4 2082/83. This indicates that the bank remains highly dependent on customer deposits and may need to diversify its funding sources by utilizing other financial instruments.
2. Other Liabilities
Other liabilities fluctuated throughout the review period. From Q4 2074/75 to Q4 2082/83, they increased marginally from Rs. 87.78 crore to Rs. 90.41 crore. This category reached its highest level of Rs. 1.12 billion in Q4 2080/81.
3. Total Liabilities
Total liabilities followed a pattern similar to customer deposits, recording an average annual growth rate of 20.56%. Since deposits constitute the largest portion of liabilities, total liabilities closely tracked deposit growth.
4. Equity Analysis
Total equity of KSBBL increased at a median annual growth rate of 11.98%. During the same period, share capital grew at a median annual rate of 4.40%, while reserves increased at a median annual rate of 19.94%.
Profit and Loss Analysis
1. Interest Income and Expenses
Interest income and interest expense represent the bank's core revenue-generating activities and the cost of funding those assets, respectively. Interest income declined after reaching its peak of Rs. 7.34 billion in Q4 2079/80. Thereafter, both interest income and interest expense decreased steadily. By Q4 2082/83, interest income had fallen to Rs. 5.19 billion.
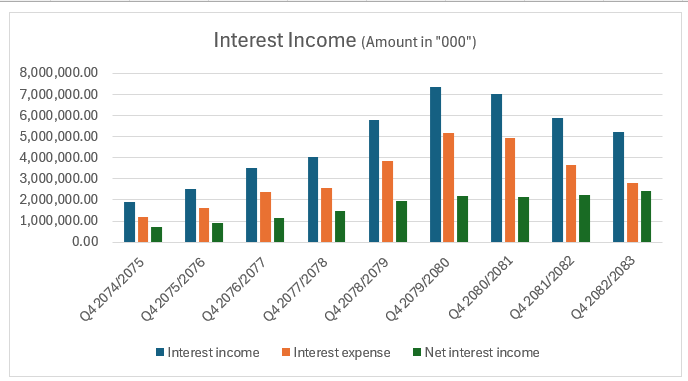
Notably, during the declining interest rate environment, KSBBL reduced its funding costs more rapidly than its lending yields. On the positive side, net interest income continued to increase. Although the interest spread rate narrowed, the bank appeared to have successfully expanded its lending business.
2. Net Fees and Commission Income
Another positive aspect of KSBBL is the steady growth in its net fees and commission income. It increased from Rs. 1.5 crore in Q4 2074/75 to Rs. 37.37 crore in Q4 2082/83, representing an increase of approximately 25 times.
3. Operating Profit and Net Profit
Operating profit reflects the bank's profitability before taxation and provisioning, while net profit represents earnings attributable to shareholders.
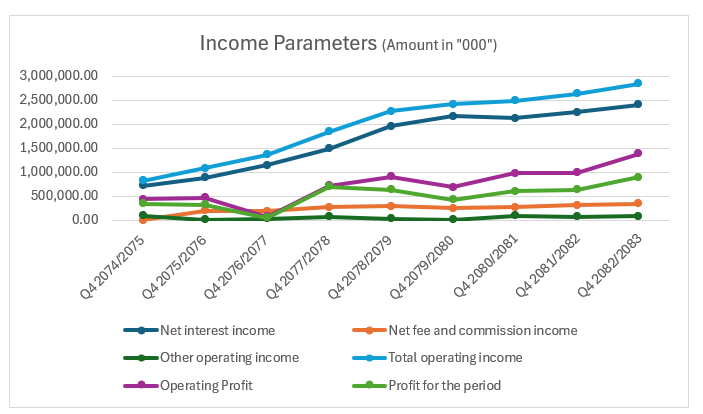
KSBBL recorded its highest-ever net profit of Rs. 894.17 million in Q4 2082/83. Overall, the bank has maintained a steady growth trend in net profits.
4. Expenses
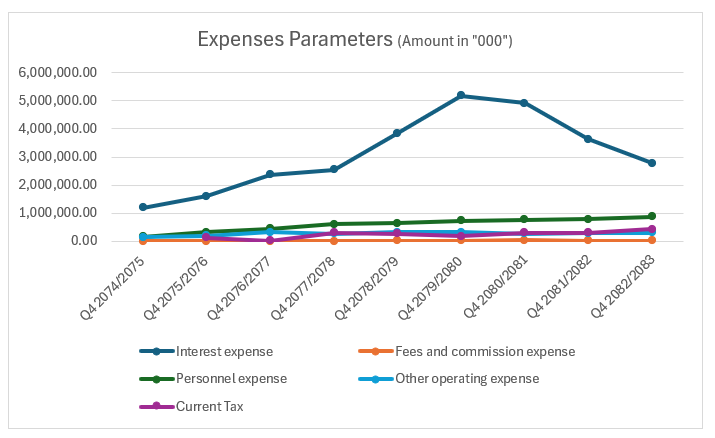
Interest expense remains the bank's largest expense and is considered the primary direct cost in the banking industry. This expense has shown a declining trend. However, persistently lower interest expenses may make it more challenging for the bank to retain depositors' funds. Other operating expenses have remained at a moderate level.
Trends in Key Performance Indicators
Earnings Metrics
Earnings Per Share (EPS)
The bank's Earnings Per Share (EPS) has experienced considerable volatility over the past nine fiscal years, reflecting changes in profitability and the overall operating environment.
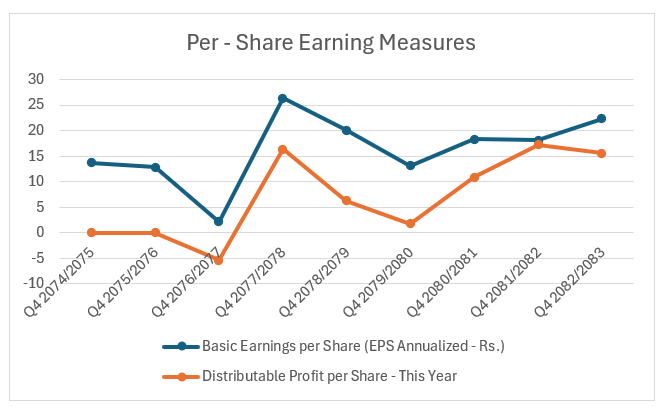
EPS remained relatively stable around Rs. 13 during FY2074/75 and FY2075/76. A sharp decline to Rs. 2.16 in FY2076/77 represents the weakest earnings performance during the review period.
The bank recorded an impressive recovery in FY2077/78, with EPS rising to Rs. 26.40, the highest level in the series. Earnings moderated over the following two years before recovering again.
Q4 2082/83 closed with EPS of Rs. 22.34, indicating that profitability has substantially improved compared to the post-pandemic years, although it remains below the peak achieved in 2077/78.
Overall, the long - term trend suggests that the bank has successfully restored profitability after a severe earnings shock.
Efficiency Measures
Return on Equity (RoE)
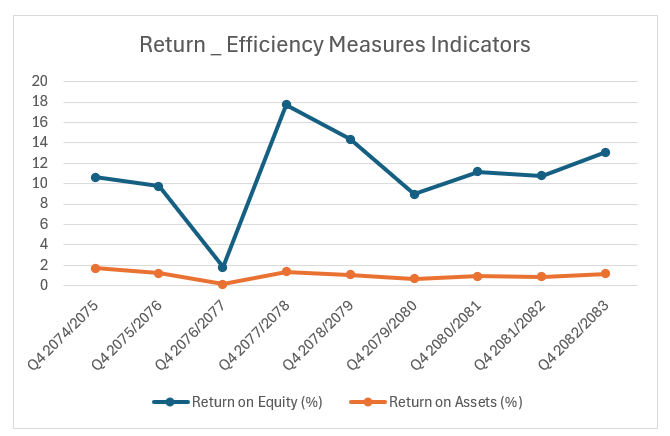
RoE broadly mirrors the movement in EPS. The ratio declined sharply to 1.79% during Q4 2076/77 due to weak profitability. It rebounded strongly to 17.77% in Q4 2077/78, demonstrating efficient utilization of shareholders' capital. Since then, RoE has remained within the 9–13% range.
FY2082/83 recorded 13.06%, reflecting improved earnings generation from shareholders' equity. Although current returns remain below the peak level, the bank has restored a healthy profitability profile.
Return on Assets (RoA)
RoA followed a similar trajectory. It declined from 1.73% to only 0.15% in FY2076/77. The ratio recovered steadily afterward. FY2082/83 recorded 1.18%, the highest level in the last five years. This indicates improving efficiency in utilizing total assets to generate profits.
Valuation Multiples
Price-to-Earnings (P/E) Ratio
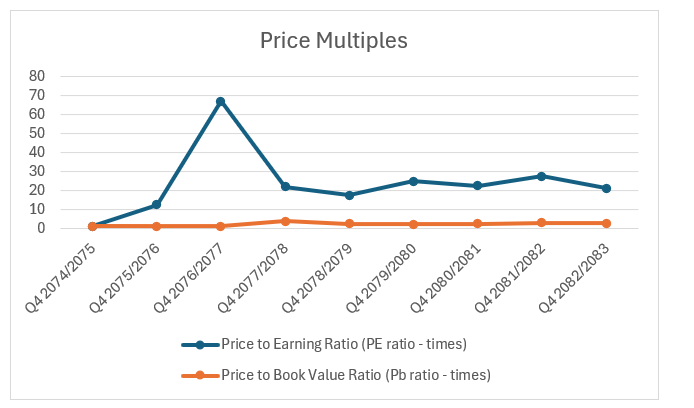
The exceptionally high 67.17 times P/E in Q4 2076/77 was primarily driven by the collapse in earnings rather than an extraordinary increase in market price. As profitability recovered, the valuation normalized.
Over the last five years, the P/E ratio has fluctuated between 17 and 28 times, suggesting relatively stable market valuation.
Price-to-Book (P/B) Ratio
The P/B ratio remained close to 1.2 times before Q4 2077/78. A sharp increase to 3.90 times indicates a substantial rise in market valuation during Q4 2077/78. Since then, the ratio has stabilized between 2.2 and 3.0 times.
Q4 2082/83 recorded 2.77 times, suggesting the market continues to value the bank well above its book value, reflecting positive investor expectations.
Health Indicators
Capital Fund to Risk-Weighted Assets declined from 23.65% in Q4 2074/75 to 12.26% in Q4 2079/80 due to business expansion. It subsequently improved to 14.16% in Q4 2082/83.
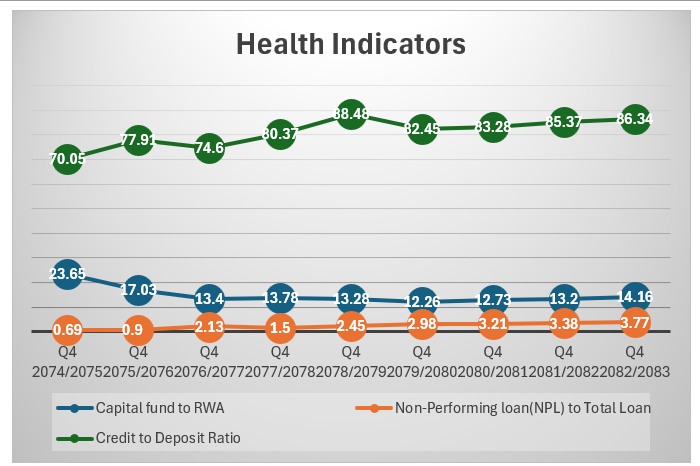
The NPL ratio has shown a consistent upward trend over the review period. It increased from 0.69% to 3.77%, indicating gradual deterioration in loan quality. Although the current level remains manageable, continued growth in impaired loans warrants closer monitoring.
The cost of funds declined significantly from 9.25% to 3.69%, reflecting easing interest rates and lower deposit costs. Similarly, Base Rate declined from 12.58% to 5.53%.
Interest Spread narrowed from 5.22% to 3.98%, indicating increasing competition and pressure on lending margins.
Dividend History
The bank's dividend history demonstrates that shareholder returns have closely followed its earnings performance.
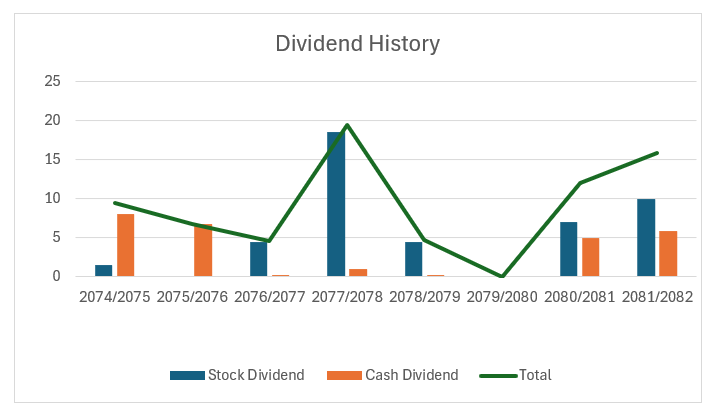
Dividend payouts weakened significantly during periods of lower profitability, particularly in FY2076/77 and FY2079/80. However, the strong recovery in dividends over the last two fiscal years, supported by rising distributable profits and improving earnings, indicates an enhanced capacity to reward shareholders.
Note: This article provides an analysis of KSBBL's financial report only and does not attempt to draw any conclusions or make any investment decision making judgments.